New DDP Indicators and GST Collections Reveal Economic and Cultural Shifts: If you’ve been tracking India’s rapid growth, you might have noticed a big change in how Uttar Pradesh is measuring its economic pulse. The state recently rolled out new District Domestic Product (DDP) indicators and started paying close attention to Goods and Services Tax (GST) collection trends. At first glance, it might sound like bureaucratic number-crunching — but in reality, these numbers are like economic X-rays, showing exactly how people are living, spending, and even redefining culture in their districts. They reflect lifestyle changes, emerging market opportunities, and deeper cultural trends that go far beyond the surface.
New DDP Indicators and GST Collections Reveal Economic and Cultural Shifts
The new DDP indicators and GST collection trends are more than just statistical updates. They are a real-time cultural and economic mirror, reflecting the way people live, spend, and interact in their communities. For businesses, these insights can shape investment and marketing strategies. For policymakers, they offer a sharper lens for development planning. And for citizens, they provide a better understanding of how their district fits into the state’s economic story. In short: the districts that learn to read and respond to their own data will be the ones leading Uttar Pradesh’s next wave of growth.
| Aspect | Details |
|---|---|
| New DDP Indicators | Expanded from 26 to 76, covering GST data, healthcare, education, sanitation, water supply, environment, and agriculture. |
| Beauty Parlour GST Leaders | Gautam Buddh Nagar: ₹11.21 crore (+38.45%), Ghaziabad: ₹7.24 crore (+34.02%), Lucknow: ₹4.7 crore (+33.76%). |
| Top Entertainment Spending | Lucknow: ₹24.5 crore (+69.93%), Noida: ₹16.14 crore (+137.27%), Moradabad: ₹4.46 crore. |
| Fastest Growth in Beauty GST | Varanasi: +68.07%, from ₹1.81 crore to ₹3.05 crore. |
| Policy Impact | Better data helps districts tailor development plans for health, education, and economy. |
| Official Source | Uttar Pradesh Planning Department |
What Are DDP Indicators — and Why the Update Matters?
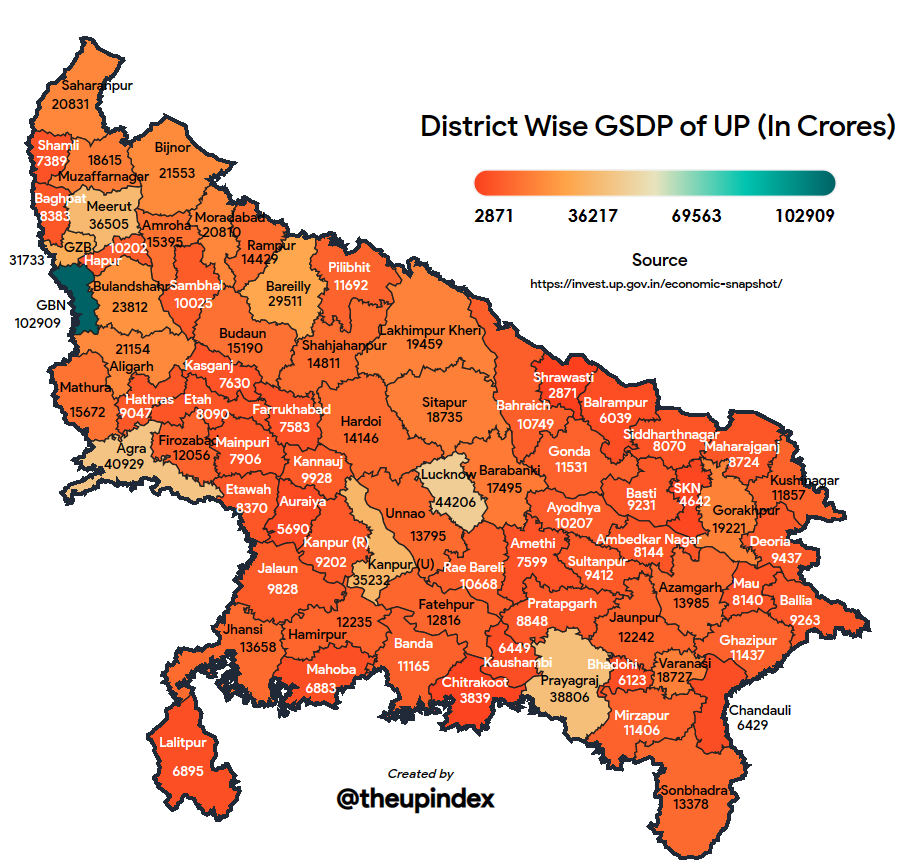
Think of the District Domestic Product as a district’s own mini-GDP. It measures all goods and services produced within that district. Until recently, Uttar Pradesh used 26 indicators for this — but now, they’ve expanded to 76.
That means the data isn’t just about factories and farms anymore. Now it covers beauty parlour GST, hospital capacity, school enrollments, water supply, electricity use, forest cover, crop yields, and more. This paints a fuller, more human picture of how each district is doing.
The upgrade isn’t just technical — it’s a move toward data-driven governance. By capturing more granular indicators, district administrations can spot strengths, address weaknesses, and design more targeted development plans.
The GST Angle — Following the Money
GST collections tell a surprisingly rich story. They reveal not just economic size, but how people choose to spend, and which industries are formalizing fastest.
Beauty Parlour Boom
- Gautam Buddh Nagar (Noida): ₹11.21 crore in GST from parlours (+38.45% from last year).
- Ghaziabad: ₹7.24 crore (+34.02%).
- Lucknow: ₹4.7 crore (+33.76%).
- Varanasi: Fastest growth at +68.07%.
This isn’t only about cosmetics. In economic terms, beauty parlour GST reflects rising discretionary spending, greater self-care culture, and an increase in formalized service businesses.
Entertainment Spending Surge
- Lucknow: ₹24.5 crore (+69.93%).
- Noida: ₹16.14 crore (+137.27%).
- Moradabad: ₹4.46 crore.
More spending on movies, concerts, and events points to growing leisure economies, better infrastructure, and changing cultural habits. In many ways, this mirrors urban consumption patterns in U.S. cities where entertainment hubs become major economic drivers.
Historical Context — How Far We’ve Come
Five years ago, district-level economic data in India was often limited, outdated, and not granular enough to guide real-time decisions. Many districts relied on annual reports that missed emerging trends.
With GST’s nationwide rollout in 2017 and its subsequent integration into local economic tracking, policymakers now have near real-time tax-based consumption data.
The jump from 26 to 76 indicators is similar to how U.S. cities moved from basic census and tax data to integrated “city dashboards” tracking everything from housing to bike usage. This shift enables faster, better-targeted policies.
Expert Voices
“When parlour GST grows by 60% in a district, it’s telling you more than beauty trends. It’s signaling that incomes are rising, social behaviors are shifting, and local business ecosystems are expanding.” — Dr. Ramesh Verma, Economist, Lucknow University
“Entertainment spending is a great proxy for confidence. People spend on leisure when they feel secure about their future income.” — Meera Joshi, Urban Development Consultant
Case Studies
Noida’s Double Boom
Noida isn’t just a corporate hub — it’s now an epicenter of lifestyle spending. With double-digit growth in both beauty and entertainment GST, it signals a district thriving in personal care and leisure sectors. Businesses offering premium services, such as luxury spas or themed entertainment venues, can ride this wave.
Varanasi’s Beauty Leap
While smaller in absolute numbers, Varanasi’s 68% jump in parlour GST is remarkable. Likely boosted by tourism, weddings, and a younger population adopting modern grooming habits, this could foreshadow a transformation in small-city consumer culture.
Sector-Wise Insights from the New DDP Indicators and GST Collections Reveal Economic and Cultural Shifts
The 50 new indicators added to the DDP framework don’t just measure spending — they reflect a district’s overall development ecosystem:
- Healthcare – Tracks both public and private facilities, bed counts, and patient volumes.
- Education – Measures school infrastructure, teacher-student ratios, and enrollment rates.
- Sanitation & Water Supply – Includes tap water access under Har Ghar Jal Yojana and Swachh Bharat allocations.
- Energy Usage – Captures electricity consumption trends, which also serve as proxies for industrial and household activity.
- Environment & Agriculture – Forest cover, crop yields, irrigation patterns, and sustainable farming metrics.
- Labor & Employment – EPFO data on employer contributions gives a sense of formal job creation.
This shift means that DDP data is no longer just about economic size — it’s about quality of life.
How Businesses Can Use This Data
- Spot Growing Markets – High GST growth rates highlight where consumer spending is heating up.
- Adjust Product Offerings – Urban districts may demand luxury, while rural ones may want affordable quality.
- Plan Seasonal Campaigns – Festivals, tourism seasons, and wedding months can be mapped for marketing.
- Benchmark Performance – Compare your business growth with district trends to gauge market share.
How Policymakers Can Use This Data
- Infrastructure Planning – Rising entertainment GST? Build better roads and improve public safety near venues.
- Targeted Training Programs – Growth in beauty GST? Offer skill certification for salon professionals.
- Tourism Strategies – High leisure spending could be leveraged into destination branding.
- Balanced Development – Identify lagging districts and channel targeted investments.
Global and U.S. Parallels
If you’re in the U.S., think of Noida’s beauty GST boom like New York’s nail salon surge post-2010 — both tied to urban affluence and changing cultural habits. Similarly, Lucknow’s entertainment surge is comparable to Austin’s growth as a live music and events hub.
GST Collection Hits ₹1.96 Trillion in July—But Why Net Revenue Isn’t Keeping Up
₹16.30 Crore Tax Evasion Bust: Central GST Officers Arrest Key Suspect
Big GST Cuts, But Who Really Benefits? Profiteering Worries Raise Red Flags


